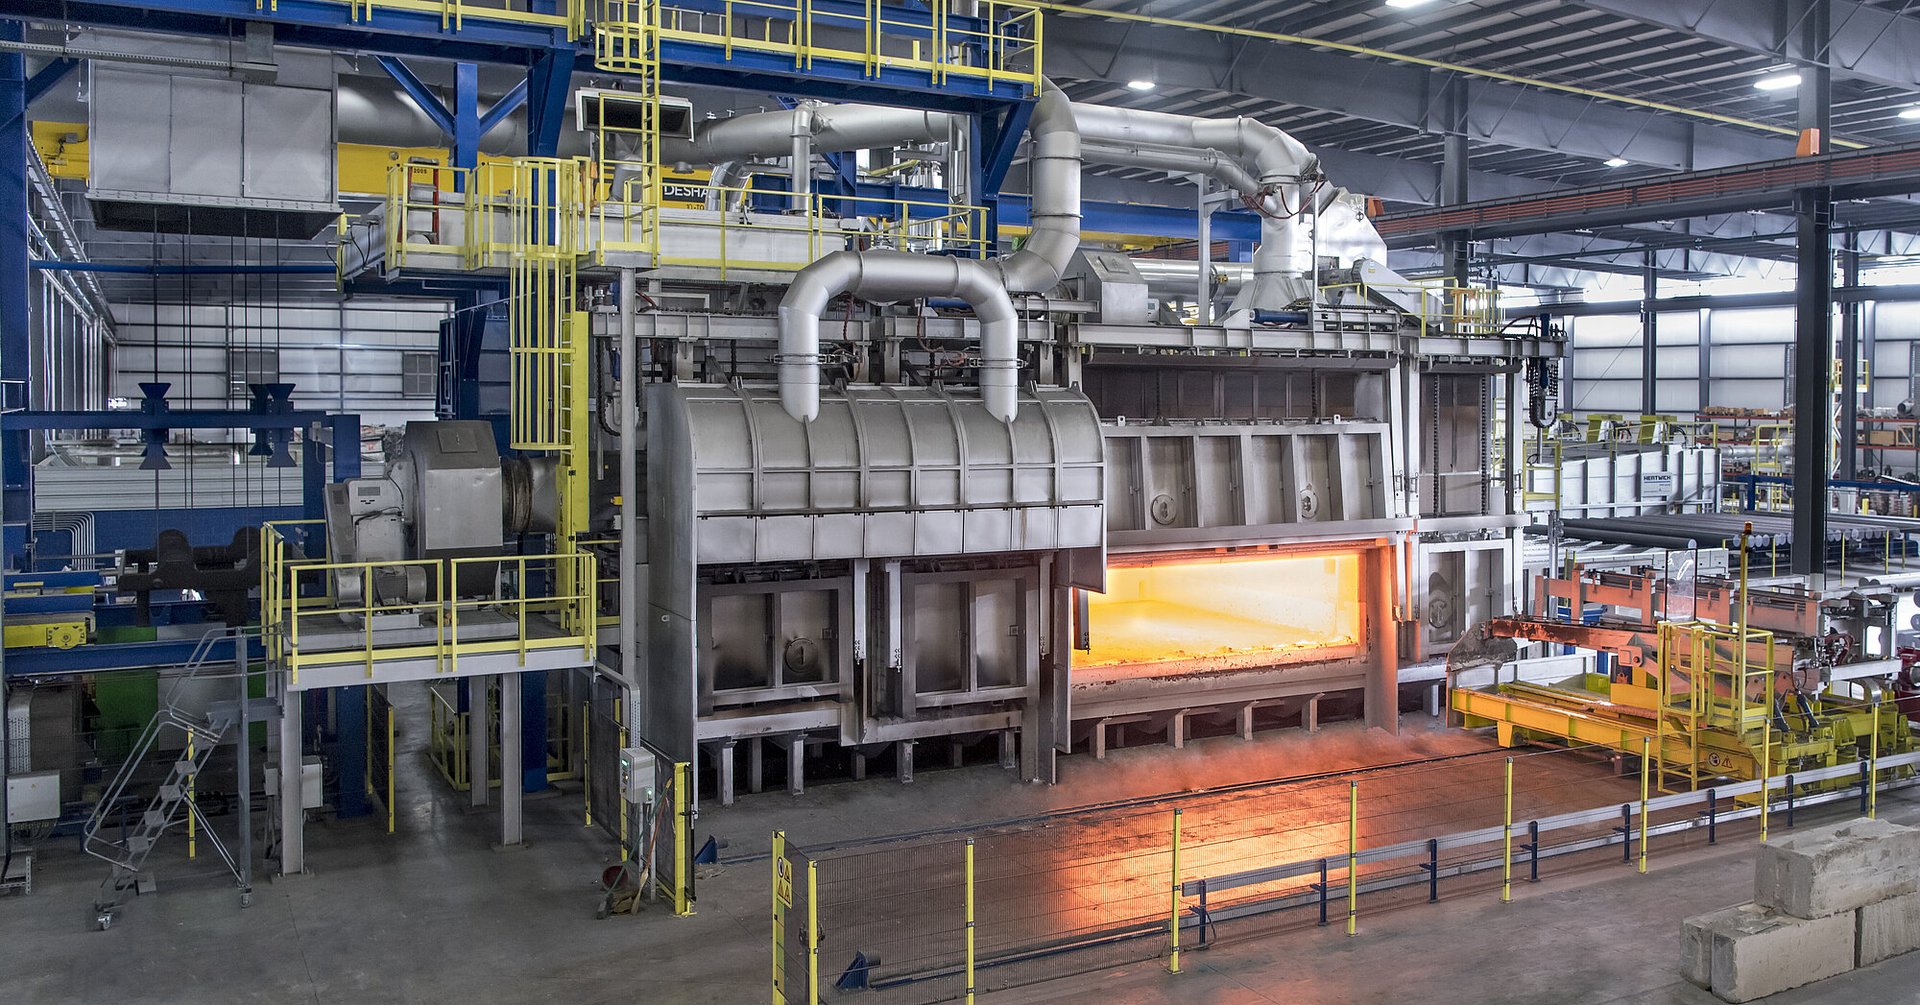
MRF
MRF
Information on the sources of MSW was provided by a number of EMB Regional Offices in addition to data from submitted SWM plans of the municipalities. The available information from 2008 to 2013 was synthesized and summarized in Figure 1.
MSW comes from residential, commercial, institutional and industrial sources. Residential waste constitutes the bulk (56.70%) of MSW and includes kitchen scraps, yard wastes, paper and cardboards, glass bottles, plastic containers and sando bags, foils, soiled tissues and diapers, and special wastes such as containers of household cleaning agents, batteries and waste electrical and electronic equipment (WEEE).
Commercial sources include commercial establishments, public and/or private markets which contribute 27.10% and some regions, about two- third (2/3) of commercial wastes come from the latter. Institutional sources such as government offices, educational and medical institutions account for about 12.10% while the remaining 4.10% are waste coming from the industrial or manufacturing sector.
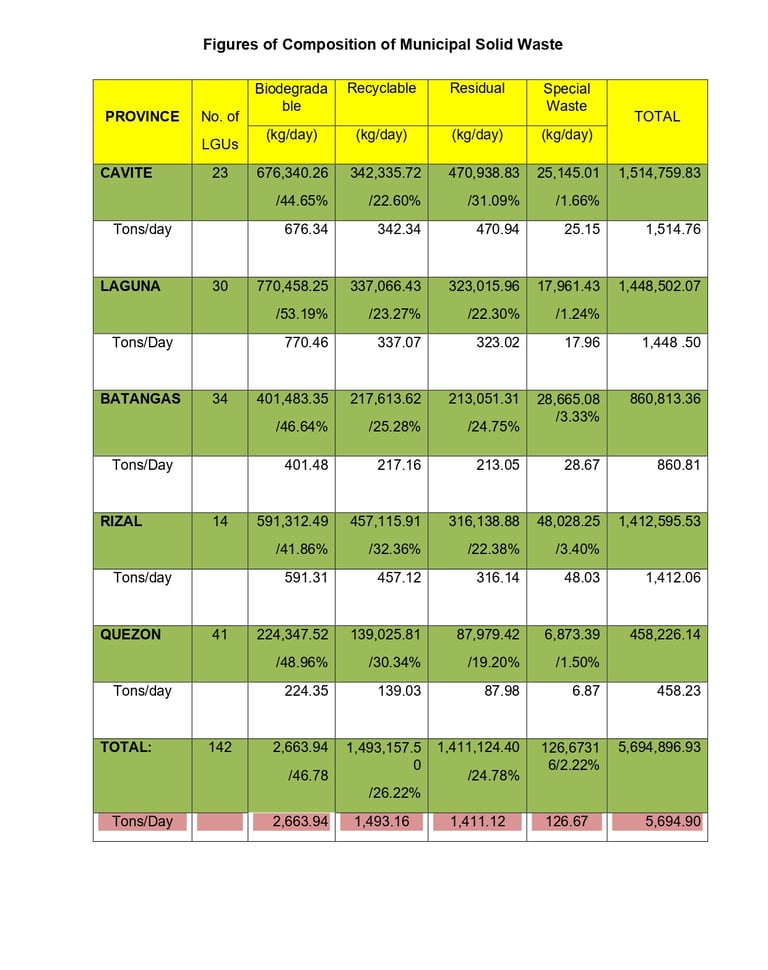
Composition of Municipal Solid Waste
Information on the sources of MSW was provided by a number of EMB Regional Offices in addition to data from submitted SWM plans of the municipalities. The available information from 2008 to 2013 was synthesized and summarized in Figure 1.
MSW comes from residential, commercial, institutional and industrial sources. Residential waste constitutes the bulk (56.70%) of MSW and includes kitchen scraps, yard wastes, paper and cardboards, glass bottles, plastic containers and sando bags, foils, soiled tissues and diapers, and special wastes such as containers of household cleaning agents, batteries and waste electrical and electronic equipment (WEEE).
Commercial sources include commercial establishments, public and/or private markets which contribute 27.10% and some regions, about two- third (2/3) of commercial wastes come from the latter. Institutional sources such as government offices, educational and medical institutions account for about 12.10% while the remaining 4.10% are waste coming from the industrial or manufacturing sector.
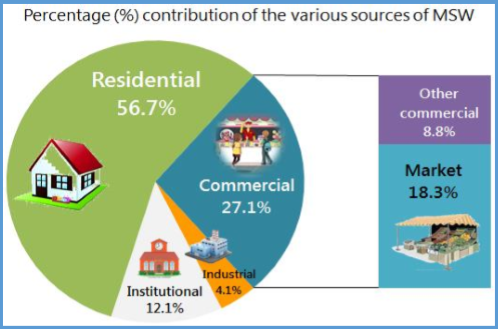
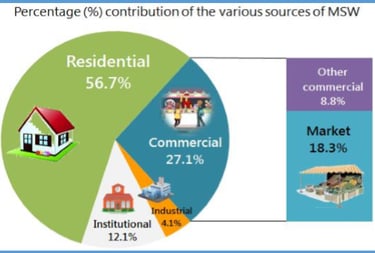
FIGURE 1 : Solid Waste Percentage
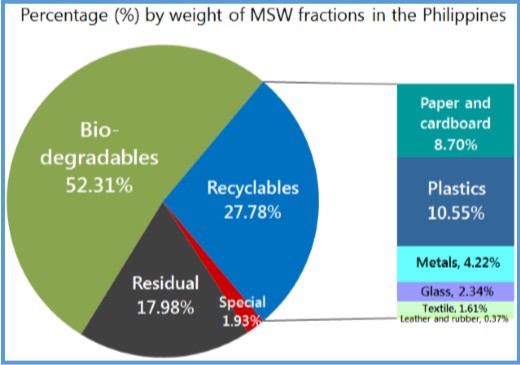
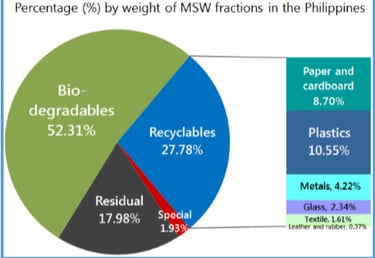
FIGURE 2 : Composition of municipal solid waste in the Philippines, 2008-2013
Biodegradable wastes
comprise about half (52.31%) of MSW although primary data suggest that figures can range from 30 to as much as 78%. Typical bio-waste consists of kitchen wastes and yard/garden wastes. From the available information, it could be estimated that 86.20% of compostable waste comes from kitchen scraps while 13.80% are leaves and twigs.
Recyclable wastes
account for almost a third (27.78%) of MSW with an estimated range of 4.1 to 53.30%. Plastic packaging materials comprise 38% of this waste fraction and followed by paper and cardboard wastes which contributes about 31%. The remaining 31% is made up of metals, glass, textile, leather and rubber.
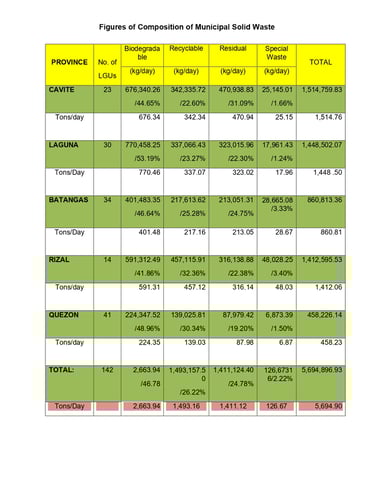
Special wastes
which consist of household healthcare wastes, wastes from electrical and electronic equipment (WEEE), bulky waste and other hazardous materials contribute a measly 1.93% with values ranging from a negligible amount up to 9.20%.
Finally, residuals have been found to make up 17.98% of generated MSW. Most LGUs present this data as a combination of disposable wastes as well as inert materials, which comprise about 12% of the residual waste.